
Cyclic voltammetry (CV) is a technique to study the behavior-velocity-control steps of electrochemical reactions at the electrode/electrolyte interface, which is a simple, rapid and informative method for obtaining cyclic voltammetric curves, and has a wide range of applications in the fields of materials science, chemistry, environmental science and biochemistry, etc. In particular, it is indispensable for advancing the knowledge and technology in the field of electrochemistry. In particular, it is of indispensable importance to promote the development of knowledge and technological progress in the field of electrochemistry. Cyclic voltammetry can be used to determine the reversibility of electrodes, the mechanism of electrode reaction and quantitative analysis in electrochemical experiments.
The principle of cyclic voltammetry (CV) lies in the fact that it applies a linearly varying potential (voltage) to the electrode surface and monitors the corresponding current response, i.e., the relationship between the electrode surface current and potential. The kinetics and mechanisms of electrochemical reactions are investigated by characterizing the response at the electrode surface. This method involves controlling the electrode potential and recording the current flowing through the electrode during the change in potential, resulting in a current-potential (i-E) plot.
In cyclic voltammetry, a complete cycle is formed by starting from a starting potential, increasing linearly at a certain scan rate to a set final potential, and then scanning back to the initial potential in reverse at the same rate. This process can be repeated several times to obtain detailed information about the electrochemical reaction. By analyzing the cyclic voltammograms obtained, important information about the redox peaks, peak potentials, peak currents, and reversibility of the reaction can be obtained. For example, when the voltage is scanned from low to high, an oxidation peak that generates an oxidation current occurs, while a reduction peak occurs when the voltage is scanned in the reverse direction.
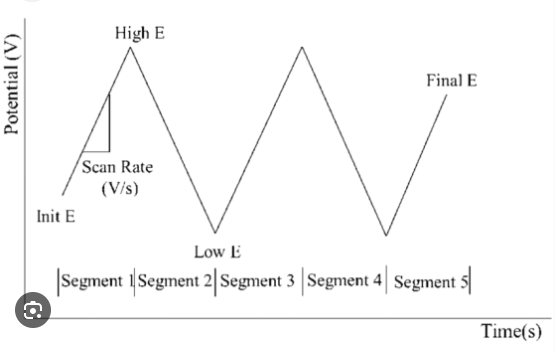
Figure 1: Excitation signal diagram for cyclic voltammetry.
Cyclic voltammetry is one of the most common test methods in the field of electrochemistry. To further understand the actual analysis process, it is necessary to understand the equipment and parameter settings required for cyclic voltammetry testing. The following is an example of the cyclic voltammetry setup in Neware’s CT-8002S-5V100mA-124 battery test system and the accompanying test software BTS 8.0.1.
The CT-8002S-5V100mA-124 battery testing system is specially developed for battery material research and 3C battery testing. In addition to standard charge/discharge test functions, it also integrates EIS (Electrochemical Impedance Spectroscopy, which will be online in June 2025), DCIR (DC Internal Resistance Test), CV (Cyclic Voltammetry Test), and Pulse Simulation to meet the comprehensive test requirements.
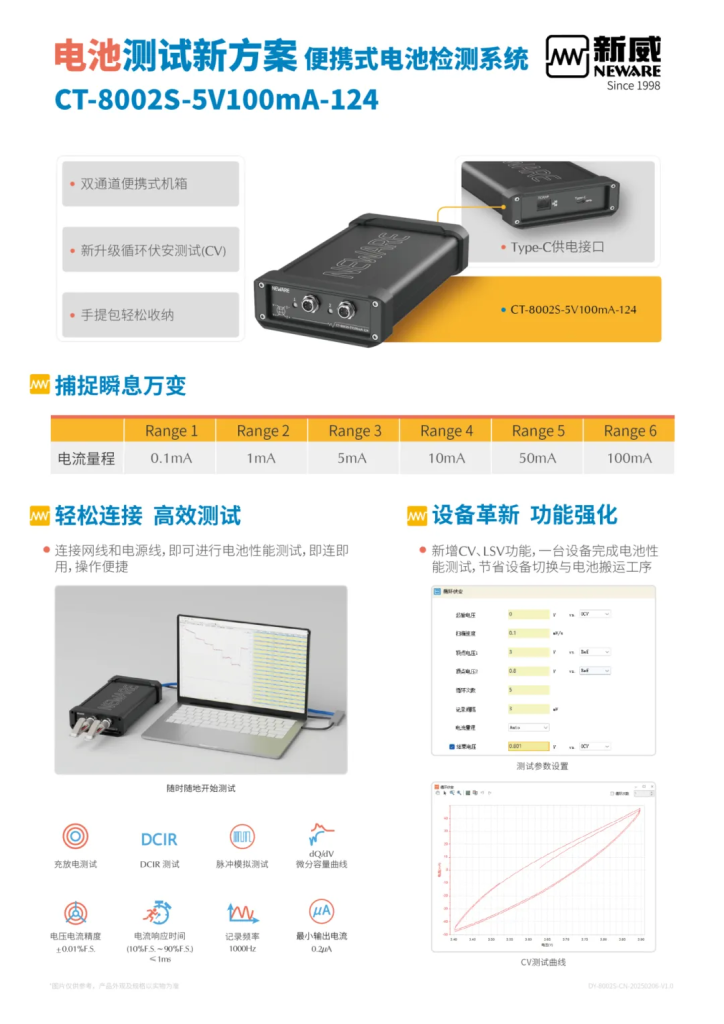
Figure 2: Neware CT-8002S-5V100mA-124 Battery Test System
Step setting of cyclic voltammetry
In the work step of cyclic voltammetry, the parameters that need to be set are start voltage, scanning speed, vertex voltage, cycle number, recording interval, current range, and end voltage.
●Start voltage: the voltage at which the scanning starts, usually from the open circuit voltage.
●Scanning speed: the speed of voltage change during scanning.
●Vertex voltage: the voltage range of repeated scanning, first scanning to the vertex voltage 1, then scanning to the vertex voltage 2, in order to reach 1 and 2 successively as a circle.
●Cycle number: the number of repeated scans between two vertices.
●Recording interval: i.e. voltage recording condition.
●Current range: The current range used for the test should be greater than the maximum current of the test process.
●End Voltage: after reaching the set number of cycles, scanning from vertex voltage 2 to this voltage can be not enabled.
Set the above parameters, you can start the test.
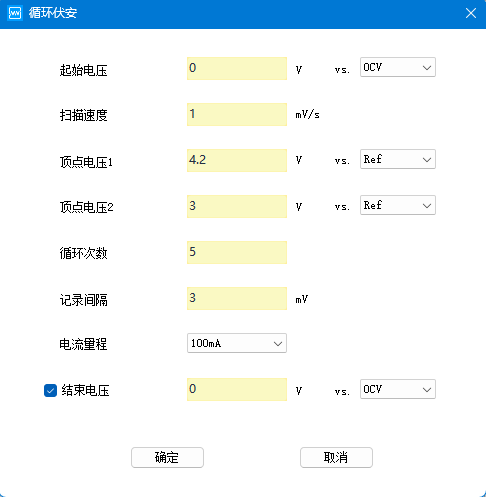
Figure 3: Step setup for cyclic voltammetry test.
Data Processing for Cyclic Voltammetric Testing
At 1 in the figure – General graphing tools, including grab, zoom, restore, copy, etc.
At 2 in the figure-Cyclic lap view, unchecked shows all the loops, after checking, you can use the digital stepper or directly enter the number to view the graph of each lap.
Figure in 3 places – right-click menu, mainly use copy data, click copy data, you can copy the data of the current rendering of the graph, paste into the software plotting can be.
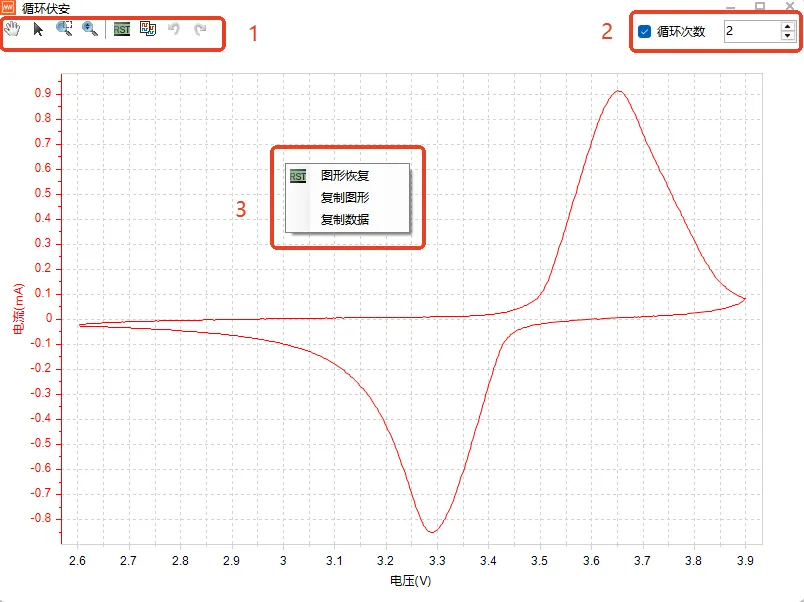
Figure 4: CV curve
Application of cyclic voltammetry
1. Determine the characteristics of the electrode reaction
(1) Determine the reversibility of the electrode reaction
Reversible electrodes:
a. The current-voltage curves of the positive and negative sweep phases of the cyclic voltammogram are symmetrical in shape.
At this time, the peak current: Ipc = Ipa. If there is the disappearance of the originally existing peaks or the generation of new peaks, it means that an irreversible reaction has occurred at the electrode interface.
b. The difference between anode peak potential and cathode peak potential is small,
Peak potential: Δφ = φpa – φpc = 2.22RT/nF (mV); when T = 25℃, Δφ = 55.6/n (mV)
c. Change the scanning speed, the peak potential is unchanged, the peak potential is independent of the scanning rate.
Irreversible electrodes:
a. Usually single peak, no sweepback peak, or positive peak, or the upper and lower curves are asymmetric, and the peak current Ipc:Ipa is significantly greater or less than 1.
b. Between the difference between the anodic peak potential and the cathodic peak potential, the larger the distance the greater the degree of irreversibility
c. Change the scanning speed, E moves with V, and the peak potential is significantly affected by the scanning rate.
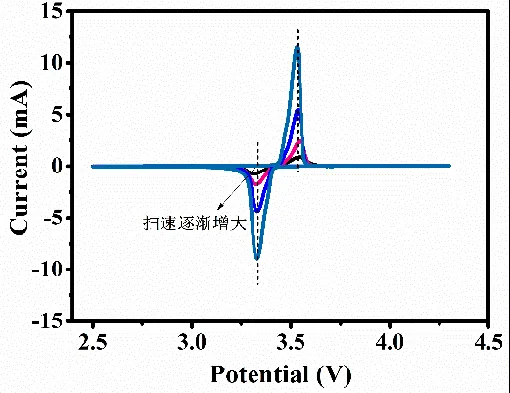
Figure 5: CV curves of the equilibrium electrochemical system
Quasi-reversible processes:
The peak shape, peak potential, and peak current are related to the potential scan rate in addition to the number of charges transferred, temperature, and reactant/product concentration-diffusion. In general, the potential difference Δφ between the oxidation and reduction peaks of a quasi-reversible electrochemical reaction becomes larger as the sweep rate increases (e.g., Fig. 6). However, this is not the case for the fully reversible electrochemical system, as shown in Fig. The potentials of the oxidation and reduction peaks remain essentially unchanged as the sweep rate increases.
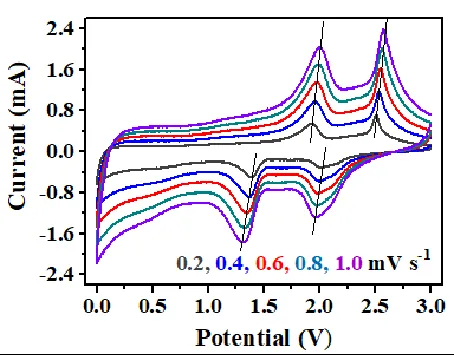
Figure 6: CV curves for quasi-equilibrium electrochemical systems
(2)Study of the nature of electrode processes
Control steps at the electrode: Electrically active substances first reach the electrode surface by a diffusion process and then are adsorbed on the electrode surface by an adsorption process to participate in the reaction. The two successive processes are controlled by the slower process, for example, the diffusion process is slower and is the control process for the whole reaction.
Electrode process control mechanism: oxidation peak or reduction peak current is proportional to the scan rate (linear relationship) indicates that the electrode process is mainly controlled by kinetic reaction. The peak current is linearly related to the square root of the scan rate, and the electrode process is mainly controlled by diffusion.
Neware was founded in 1998. We are trusted by ATL, BYD, CATL, Tesla, Apple, HUAWEI, SolarEdge, etc. We provide battery testing solutions for testing battery cell, module, pack, supercapacitor, BESS, etc. If you want to do capacity, cycle life, pulse, DCIR, GITT, HPPC, or EV driving simulation test, please feel free to contact us.