The basic concept of thermogravimetric (TG) analysis
It is a technique that measures the relationship between the mass of a substance and temperature or time under a programmed temperature. By analyzing the thermogravimetric curve, we can determine the composition, thermal stability, thermal decomposition of the sample, and its possible intermediate products, as well as information related to the product’s quality. The applications of thermogravimetric analysis are primarily in metal alloys, geology, polymer materials research, and pharmaceutical research.
Derivative thermogravimetric analysis is derived from thermogravimetric analysis and involves recording the first derivative of the TG curve with respect to temperature or time. The experimental result is the derivative thermogravimetric curve, known as the DTG curve. The DTG curve has the mass change rate as the y-axis, indicating a decrease from top to bottom, while the x-axis represents temperature or time, increasing from left to right.
The main feature of thermogravimetric analysis is its quantitative nature, allowing for the precise measurement of mass changes and their rates in materials. Given this characteristic, any material that undergoes a mass change when heated can be studied using thermogravimetric analysis. Both physical and chemical changes can be detected through this method. We observe mass changes in these processes, such as sublimation, vaporization, adsorption, desorption, absorption, and gas-solid reactions.
The test instrument and basic principle of thermogravimetric (TG) analysis
The instrument for thermal gravimetric analysis, known as the thermogravimetric analyzer, is mainly composed of three parts: temperature control system, detection system and recording system.
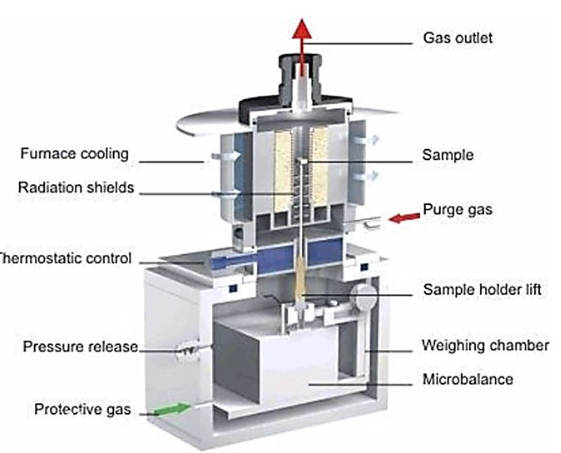
The fundamental principle of a thermal gravimetric analyzer involves placing the sample in a high-temperature resistant container, which is situated within a programmable-temperature-controlled furnace. The sample is suspended from a highly sensitive and accurate balance. As depicted in Figure 1, during heating or cooling, the weight change of the sample due to reactions can be measured by the aforementioned balance. A set of thermocouples is positioned near the sample without direct contact to measure the temperature surrounding the sample, thereby enabling precise temperature measurement and control of the furnace’s temperature profile.

Figure-1-The-structure-diagram-of-thermogravimetric-analyzer
Influence factors of thermogravimetric (TG) analysis
The results of thermogravimetric analysis are related to the experimental conditions. In order to obtain the thermogravimetric curve with good accuracy and repeatability, it is necessary to carefully analyze various influencing factors. Among them, the factors affecting the thermogravimetric test results can be basically divided into three categories : instrument factors, experimental conditions factors and sample factors.
1.Instrumental factors: including gas buoyancy and convection, crucible, volatile condensation, balance sensitivity, sample holder and thermocouple.
For a given thermogravimetric instrument, the effects of balance sensitivity, sample holder and thermocouple are fixed, and we can reduce or eliminate these systematic errors by mass correction and temperature correction, where:
(1)The influence of buoyancy: the gas around the sample expands due to the increase of temperature, and the specific gravity decreases, so the TGA value of the sample increases.
(2)The influence of convection: The generation of convection makes the measurement fluctuate.
(3)The effect of condensed matter: The volatile matter produced by the decomposition of the material may be condensed on the colder part connected to the weighing dish, which affects the measurement results of weight loss.
2.Experimental condition factors: including the influence of heating rate and atmosphere.
(1)Effect of heating rate: The heating rate has a great influence on the thermogravimetric curve. The higher the heating rate, the greater the impact. Because the sample is heated by heat transfer through the medium-crucible-sample, a temperature difference can be formed between the furnace and the sample crucible. The temperature difference between the furnace and the sample crucible is different when the heating rate is different, which leads to the measurement error. Generally, the effect is small when the heating rate is 5 and 10 °C/min. The heating rate can affect the shape of the thermogravimetric curve and the decomposition temperature of the sample, but does not affect the weight loss. Slow heating can study the decomposition process of the sample, but we cannot arbitrarily believe that rapid heating is always harmful. It depends on the specific experimental conditions and purposes. When the sample amount is very small, the rapid heating can check out the intermediate products formed in the decomposition process, while the slow heating can not achieve this purpose.
(2)The influence of atmosphere: atmosphere mainly has the following categories : inert atmosphere, oxidizing atmosphere, reducing atmosphere, and other such as CO2, Cl2, F2, etc. The atmosphere has an effect on the results of the thermogravimetric experiment. It can affect the nature, direction, rate and temperature of the reaction, and can also affect the results of the thermogravimetric weighing.
3.Sample factors: mainly including the influence of sample quantity and the influence of sample size and shape.
(1)The effect of sample size: The amount of sample has an effect on heat conduction, thermal diffusion and volatile emission. When the sample amount is large, the thermal effect and temperature gradient are large, which is unfavorable to heat conduction and gas escape, resulting in temperature deviation. The larger the amount of sample, the greater the deviation. The amount of sample should be reduced as much as possible within the allowable range of the sensitivity of the thermal balance to obtain a good detection effect. In the actual thermal gravimetric analysis, the sample volume only needs to be about 5 mg.
(2)The influence of particle size and shape of the sample: The particle size and shape of the sample also have an effect on heat conduction and gas diffusion. Different particle sizes will cause changes in the diffusion of gas products, resulting in changes in the reaction rate and the shape of the thermogravimetric curve. The smaller the particle size, the faster the reaction rate, the lower the initial decomposition temperature and the final decomposition temperature on the thermogravimetric curve, the narrower the reaction range, and the decomposition reaction is completely carried out. Therefore, the influence of particle size is a non-negligible factor in thermal gravimetric analysis.
The research object and application of thermogravimetric (TG) analysis
Thermogravimetric analysis mainly studies the physical and chemical changes such as thermal stability, thermal decomposition and oxidative decomposition of materials in air or inert atmosphere; it is also widely used in all physical processes involving mass changes.
Among them, the application of thermogravimetric analysis is mainly in metal alloys, geology, polymer materials research, drug research and other aspects, such as :
1.Determination of the reaction between metal and gas: The reaction between metal and gas is a gas-solid phase reaction. The relationship between the mass change of the reaction process and the temperature can be determined by thermogravimetric analysis, and the kinetic analysis of the reaction amount can be made.
2.Application in geology: Mineral identification: Thermogravimetric curves of minerals show different characteristics due to their different composition and structure. The minerals can be identified by comparing the initial temperature, peak temperature and peak area with the known mineral characteristic curve.
3.Thermogravimetric quantitative analysis method: The quality of the sample changes under the program temperature control, and this phenomenon can be used to quantitatively analyze the composition of the sample. Compared with general chemical analysis methods and other methods, thermal gravimetric analysis has its unique advantages in quantitative analysis of samples, that is, the sample does not need pretreatment, the analysis does not need reagents, and the operation and data processing are simple and convenient. The only requirement is that the two mass loss processes adjacent to the thermogravimetric curve must form an obvious platform, and the more obvious the platform, the smaller the calculation error.
4.Application in polymer materials: thermal stability of materials: thermal gravimetric analysis can evaluate the thermal stability of polyolefins, polyhalogenated olefins, oxygen-containing polymers, aromatic heterocyclic polymers, monomers, polymers and polymers, elastomeric polymer materials.
The case ofthermogravimetric (TG) analysis
In general, TG and DTA are linked technologies that are used together to analyze the reaction process. This technology can be applied to the following aspects :
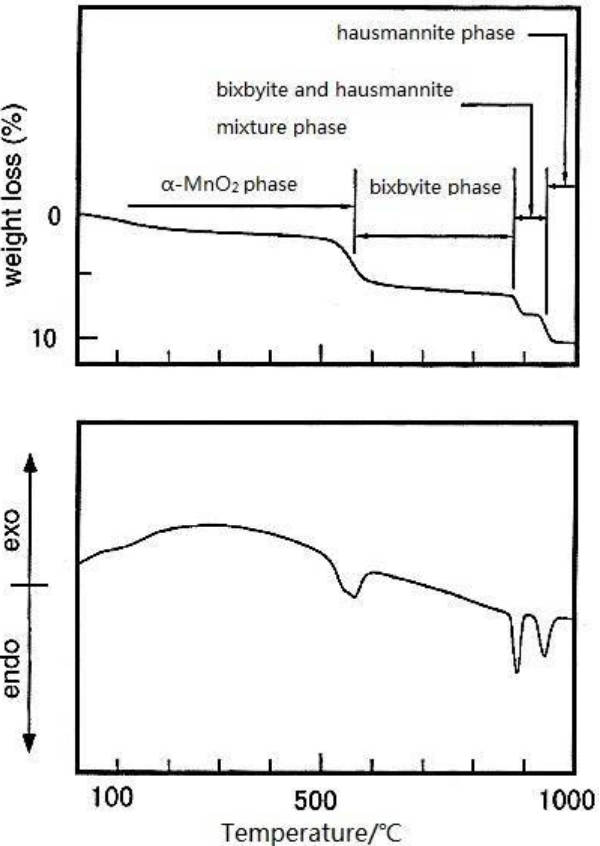
1.Analysis of the reaction process: As shown in the following figure, the researchers combined TG and DTA to explore the crystal transformation of α-MnO2 at high temperature. It can be seen from Figure 2 that the first mass loss (1.9 %) occurs at 400 °C, corresponding to the removal of decomposed water. At 530 °C, there is a second mass loss, corresponding to the release of O2, and it is speculated that there is a transformation from α-MnO2 to manganite phase (Mn2O3). The endothermic peak at 870 °C corresponds to the transformation of crystal form to manganite (Mn3O4) crystal form.

Figure-2-TG-DTA-results-of-α-MnO2
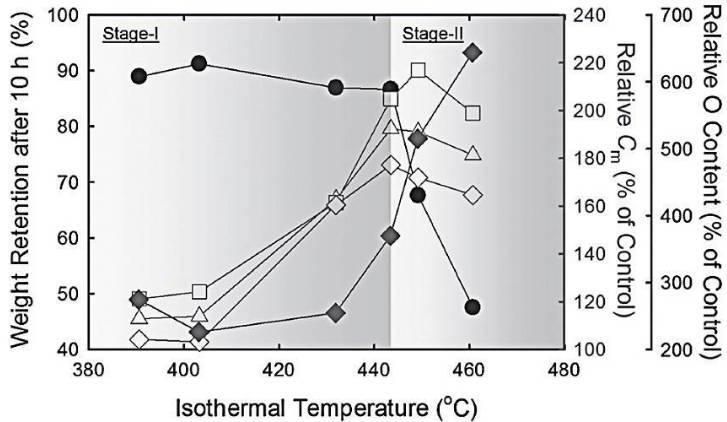
2.The TG method is used to determine the heat treatment temperature of the sample: Figure 3 shows an experimental result of using air etching technology to create pores on the graphene base surface, thereby introducing micro/mesopores. The researchers used the TG test technology (referring to the- ● -line in the figure), but it needs to be explained that here, only the results of the graphing of the remaining graphene mass after holding for 10 hours at 6 different temperatures are used, which is somewhat different from the general program temperature control. According to Figure 3, it is found that a large mass loss begins to occur at about 440 °C, which proves that this is the temperature at which graphene is etched by air. It is proved that at 440 °C, both the graphene base surface can be etched and the graphene will not be completely burned, which ensures that the graphene material with micro/mesoporous base surface can be finally obtained.

Figure-3-The-determination-of-reaction-temperature-by-TG
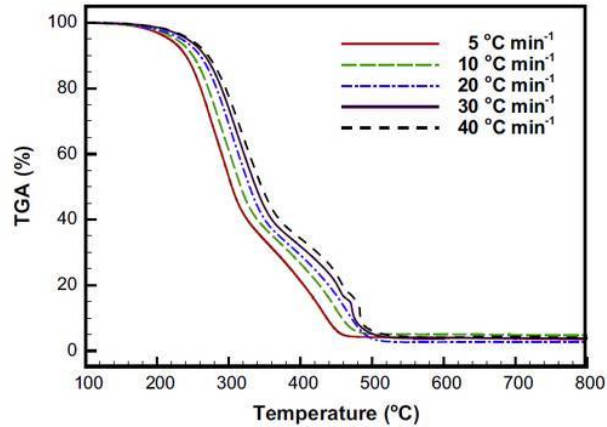
3.Using TG technology to investigate the ignition temperature and combustion temperature of fuel: Here is the test of bamboo as solid fuel. Thermogravimetric analysis was carried out at different heating rates. It can be seen from Figure 4 that two different mass loss segments correspond to different reactions. Among them, the temperature of 200-350 °C is due to the combustion and decomposition of holocellulose and lignin in bamboo, and the mass loss at 350-500 °C corresponds to the combustion of the remaining lignin and carbon.

Figure-4-Analysis-of-ignition-temperature-and-combustion-temperature-of-fuel
About NEWARE:
Neware was founded in 1998. We are trusted by ATL, BYD, CATL, Tesla, Apple, HUAWEI, SolarEdge, etc. We provide battery testing solutions for testing battery cell, module, pack, supercapacitor, BESS, etc. If you want to do capacity, cycle life, pulse, DCIR, GITT, HPPC, or EV driving simulation test, please feel free to contact us.
