
1 Introduction to Cycling Performance Testing
Battery cycling performance testing usually involves cycling a battery under specific charging and discharging conditions several times to simulate the working conditions of the battery in actual use. The purpose of the test is to monitor the degradation of the battery’s capacity during the cycling, and thus assess its cycle life and health status. Charging and discharging cycling can be used to test the battery’s charge/discharge capacity, coulombic efficiency, capacity retention rate and other performance parameters. Commonly used modes for battery charging and discharging testing in the laboratory include constant current charge/discharge (CC), constant voltage charge/discharge (CV), constant current and constant voltage charging (CC-CV), and in addition to the commonly used modes, constant capacitance charging/discharging, constant resistance discharging, and step charging/discharging modes, etc. Constant current charging/discharging and constant current and constant voltage charging modes are commonly used to test the cycle life of a battery. Cycling performance testing can be performed using Neware battery cyclers (Figure 1).

Fig. 1 CT-4008Q-5V100mA-124 Battery Testing System
In order to ensure that the battery is in a steady-state environment, temperature chambers are often utilized to create a constant temperature environment to avoid deviations caused by temperature fluctuations, or high and low temperature chambers are utilized to explore the cycle life of the battery at different temperatures. High-temperature environments accelerate chemical reactions within the battery, leading to electrolyte decomposition, SEI film decomposition and thickening, and cathode active material decomposition. These reactions deplete active lithium ions and reduce reversible capacity, while gases may be generated, increasing the internal pressure of the battery and affecting battery safety performance. A low temperature environment reduces the conductivity of the electrolyte, increases the internal resistance of the battery, and slows the migration rate of lithium ions, resulting in a reduction in the discharge capacity of the battery at low temperatures, but this loss of capacity is usually reversible, and the capacity can be partially or fully recovered when the battery is returned to ambient temperature. However, low-temperature charging may cause uneven deposition of lithium ions on the anode surface, forming lithium dendrites, which may lead to permanent damage to battery performance. It is recommended to use a battery temperature chamber(Figure 2) to control the temperature. Neware all in one is an integration of battery cyclers and temperature chambers. It saves space in the lab, and it’s a great choice for battery performance testing.

Fig. 2 WHW/WGDW Environmental Test Chamber series
2 Test step setting examples and instance data analysis
The test current can be calculated by current density, such as mA/g (current per unit mass of active substance), mA/cm2 (current per unit area of pole piece), to get the current in mA. It can also be expressed in terms of C-rate, with C-rate (C) = charge/discharge current (mA)/nominal capacity (mAh), which can be obtained by consulting the literature for the nominal capacity of the electrode material or the battery.
There are slight differences in the cycle performance step settings or parameter settings for half-cells, full-cells, and symmetric cells.
Half-cells are used to study the electrochemical activity of the electrode materials electrode materials such as redox reaction characteristics, reaction kinetics, and interactions with the electrolyte, etc. The electrode materials are used as working electrodes, and the half-cells are assembled with lithium flakes (Li) for testing. Take graphite//Li half battery as an example, choose the current density 100mA/g for testing, assuming that the mass of the active material is 0.01g, and get the charging and discharging current of 1mA, half batteries are generally used in the small current density of 50-100mA/g, and multiplication mode is generally chosen as 0.1C. Set up the step as shown in Fig. 3, and the battery is generally discharged in the first step when the study of negative electrode material is carried out in the order of the step of rest-constant-current discharging-constant-current charging. Input current is 1mA, discharging cut-off voltage is 0.01V, charging cut-off voltage is 1.0V, and the number of cycles is set to 500. The voltage range is set according to the electrode material, for example, the range of LiFePO4/Li battery can be set to 2V ~ 4.2V, which can be obtained from the literature or the test polarization curves.

Fig. 3 Example of cycling test work step settings for graphite//Li battery
Laboratories can perform full-cell cycle performance tests according to the work step settings used for half-cell tests, adjusting the voltage range based on the characteristics of the electrode materials and the tolerance of the electrolyte or solid-state electrolyte to oxidation voltage, and setting the current size as needed. The work step settings shown in the Figure below (Fig. 4) are one of the commonly used test methods for lithium battery cycle performance. The constant current-constant voltage charging followed by a 5min rest after charging completion is to optimize the charging process, allowing the battery to charge deeply and improve charging efficiency.

Fig. 4 Example of cycling test test step settings for lithium batteries
In addition, to explore the electrochemical behavior between electrode materials and electrolytes, as well as the impact on performance, symmetrical cells are prepared for long cycle life testing. The test steps are shown in Fig. 5. Constant current charging and discharging steps are set, with a time setting of 1h The current size is set according to a current density of 1mA·cm-2. Taking an electrode piece with a diameter of 1cm as an example, the current size of 0.785mA is obtained based on the current density and the area of the electrode piece. Finally, the cycling step is set, and it is recommended to set a larger number of cycles, and the test can be stopped after the test voltage is disordered.

Fig. 5 Example of cycling test step settings for symmetrical cells
3 Utilizing BTSDA for data review and performance analysis
After the test is completed, use BTSDA to view the battery cycle performance, you can set different curve contents to view different performance parameters, right-click on the curve name location, click on “Curve Settings” to open the setup interface, according to the needs of the corresponding X-axis and Y-axis content, click on the add curve can be completed. Figure 4 shows the virtual test results, “Cycle No. – Cycle No. – Discharge Specific Capacity & Charge Specific Capacity & Charge/Discharge Efficiency” curve, which can be used to observe the cycle stability and life decay trend of the battery, and to view the capacity change and coulombic efficiency of the battery in the process of long cycle.
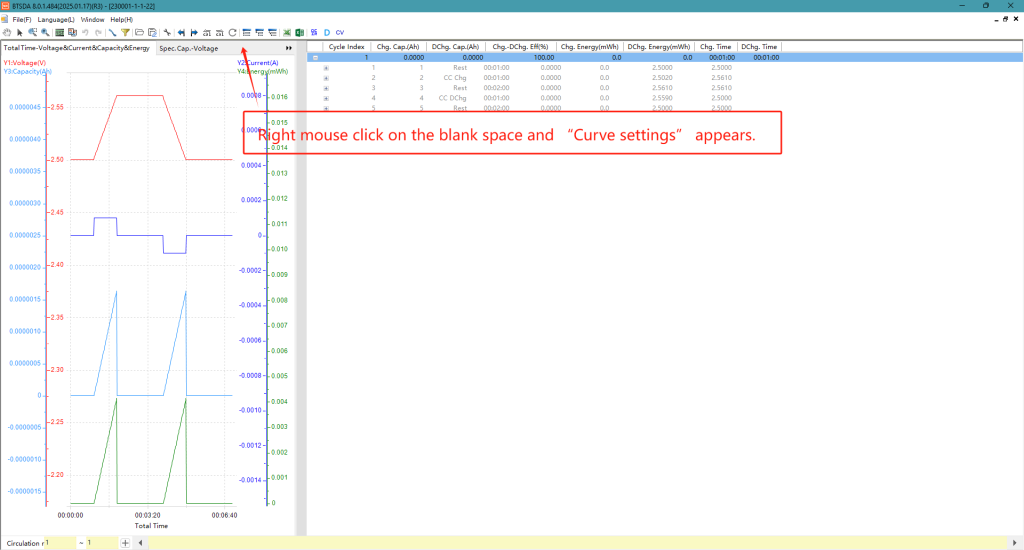
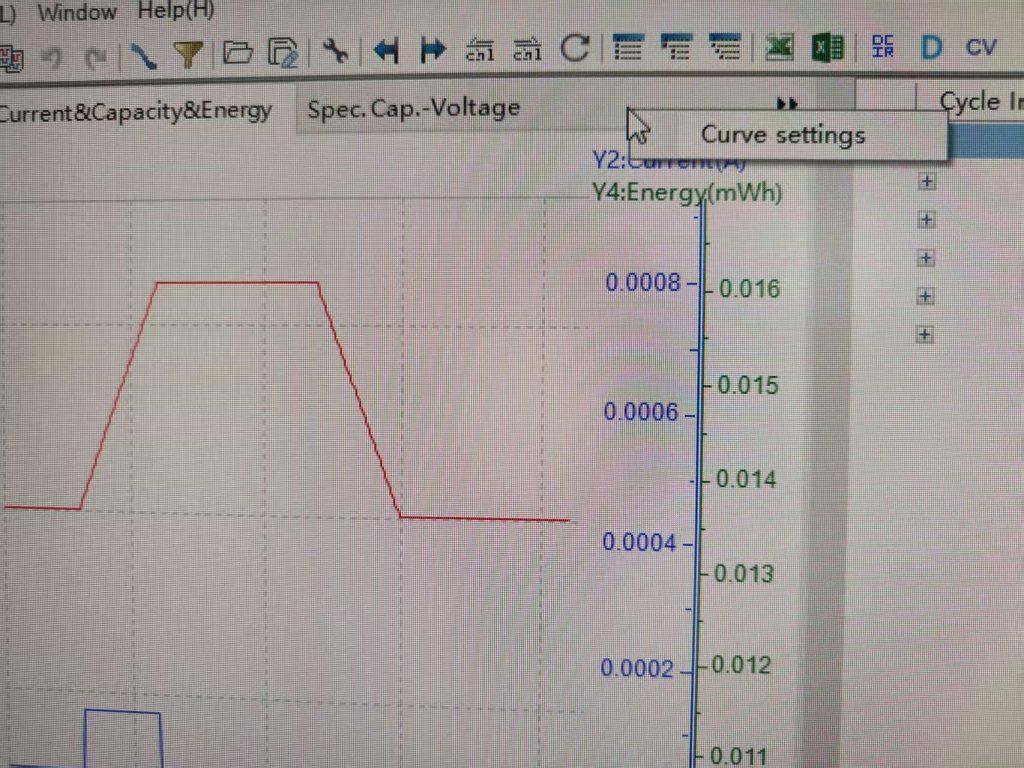
Fig. 6
In addition to that curve, the “Spec. Cap.-Voltage” curve (Fig. 7(a)) is also a conventional curve for observing the capacity changes of the battery, to view the battery’s discharge capacity, capacity at specific cycle numbers, etc. As shown in Fig. 7, it illustrates the charge and discharge curves of the battery after 100 cycles and the rate performance test under different currents, displaying the battery’s cycle performance and rate performance with the “Spec. Cap.-Voltage” and “Cycle Index-Dchg.spec. Cap.&Chg. spec. Cap.&chg.-Dchg. Eff” curves.

Fig. 7 Charge/discharge test and rate test
The performance of a symmetrical cell is viewed by looking at the “Total time-voltage” curve. As shown in Fig. 8, the Li//LiCON//Li symmetrical cell is stably cycled for 500h (1h/cycle) at current densities of 0.05 and 0.1mA·cm-2, with the voltage remaining steady and no significant increase in overpotential or irreversible fluctuations.

Fig. 8 Symmetric cell test
To conveniently view the test result curves, double-click on any axis to open the “Axis settings”, where you can set the unit of the axis, scale display range, the size and thickness of major and minor ticks, and the color of axis and curves, and other personalized detail settings. The BTSDA software provides various tools to facilitate data viewing and management. For example, the “Hand tool” and “Zoom in” can be used to move the curve and zoom in (Fig. 9(1)); when studying batteries, it is common to change a single variable to explore better electrode materials or test conditions. The “Curve comparison” (Fig. 9) is used to compare multiple test curves, making it easy to conduct parallel comparisons of data from different batteries and to directly observe the effects of performance improvement.

Fig. 9 “Curve comparison” function
4 Data export and plotting
After completing the test, it is necessary to export good data for plotting. There are several methods to export data.
The first method: If the currently viewed curve is “Spec. Cap.-Voltage” and “Cycle Index-Dchg.spec. Cap.&Chg. spec. Cap.&chg.-Dchg. Eff”, right-click on any position and click “Copy data” to copy the curve data content into an Excel file (Fig. 10).

Fig.10 Cycle test data
The second method: Utilize the “Export report” and “Multi-channel Custom report” in the toolbar to export data. Open “Export report” (Fig. 11), select to export the “WYSIWYG report”, set the export path and file name, and click export. It is recommended to export in Excel format for easy use with plotting software later. Note that the “What You See Is What You Get report” will export all data currently displayed in the right side of the software interface, with data from different levels copied according to the expanded content (Fig. 11).
If you do not need data such as time and voltage, collapse the step layer and record layer before exporting, so that only the cycle layer data will be exported. For other types of export reports, you can visit “BTS Tutorial” to view the video explanation.


Fig. 11 “Export report” feature; WYSIWYG (What You See Is What You Get) report
Learn more about NEWARE