
Today’s post is about battery cycle life
This article provides a comprehensive overview of the cycle life of batteries, a critical factor determining their performance and longevity. It covers the concept and definition of cycle life, explains how to test it through controlled charge-discharge cycles, and discusses data analysis techniques, including interpreting capacity vs. cycle number curves and voltage profiles. The article also highlights key factors influencing cycle life, such as depth of discharge, charge/discharge rates, temperature, and material properties. Finally, it underscores the importance of optimizing these factors to improve battery durability and meet growing energy storage demands.
To gain deeper insights into how cycle life is tested and analyzed, and to explore the factors that can extend or shorten a battery’s lifespan, keep reading the full article!
Introduction
Batteries have become an integral part of modern life, powering everything from small electronic devices to large-scale energy storage systems. One of the key performance indicators of a battery is its cycle life, which significantly influences its practical application and economic viability. Understanding the concept of cycle life, how to test it, and how to analyze the resulting data is crucial for both battery manufacturers and users. This article aims to provide a comprehensive overview of battery cycle life, including its definition, testing methods, data analysis techniques, and the interpretation of related curves.
Concept and Definition
The cycle life of a battery refers to the number of complete charge and discharge cycles a battery can perform before its capacity falls below a certain threshold, typically 80% of its rated capacity. Each cycle consists of a full charge followed by a full discharge. For example, if a battery has a rated capacity of 2000mAh and after a certain number of cycles its capacity drops to 1600mAh (which is 80% of 2000mAh), it is considered to have reached the end of its useful cycle life.
Cycle life is influenced by a variety of factors, including the battery’s chemistry, manufacturing process, operating conditions (such as temperature and charge/discharge rates), and the depth of discharge (DOD). Different types of batteries, such as lithium-ion, lead-acid, and nickel-metal hydride, have different inherent cycle life characteristics due to their distinct electrochemical reactions and material properties.

Testing Methods for Battery Cycle Life
Testing the cycle life of a battery is a complex process that requires careful control of experimental conditions to obtain reliable and reproducible results. The following are the main steps involved in cycle life testing:
Preparation
Before testing begins, the battery must be properly conditioned. This usually involves an initial formation charge and discharge cycle to activate the electrochemical reactions within the battery. The battery should also be checked for any defects or inconsistencies that could affect the test results.
Equipment
Specialized battery testing equipment is used to conduct cycle life tests. This equipment typically includes a programmable electronic load, a DC power supply, and a data acquisition system. The electronic load simulates the load conditions during discharge, while the DC power supply provides the charging current. The data acquisition system records the voltage, current, and temperature data throughout the test.
Learn more about Neware battery cyclers
Procedure
The battery is subjected to repeated charge and discharge cycles under controlled conditions. The charge and discharge rates (measured in C-rates, where 1C means the battery is charged or discharged at a current that would theoretically fully charge or discharge it in one hour) are carefully selected based on the battery’s specifications and intended use. For instance, a common test protocol might involve charging the battery at a constant current until it reaches a certain voltage, then holding that voltage constant until the current drops to a specified level. The discharge process is typically performed at a constant current until the battery voltage drops to a cutoff voltage.
During each cycle, the battery’s capacity is measured by integrating the discharge current over time. The cycle is repeated until the battery’s capacity degrades to the predetermined threshold (usually 80% of the initial capacity).
Environmental Control
Temperature has a significant impact on battery performance and cycle life. Therefore, the testing environment is often controlled using a temperature chamber to maintain a constant temperature. This helps to minimize the effects of temperature variations on the test results.
How are control temperature: 0~60℃ chamber / 15~60℃ chamber / high and low temperature chamber / all in one
Data Analysis and Curve Interpretation
The data collected during the cycle life test provides valuable insights into the battery’s performance and degradation characteristics. The primary data of interest includes the cycle number, capacity at each cycle, and the corresponding voltage profiles.
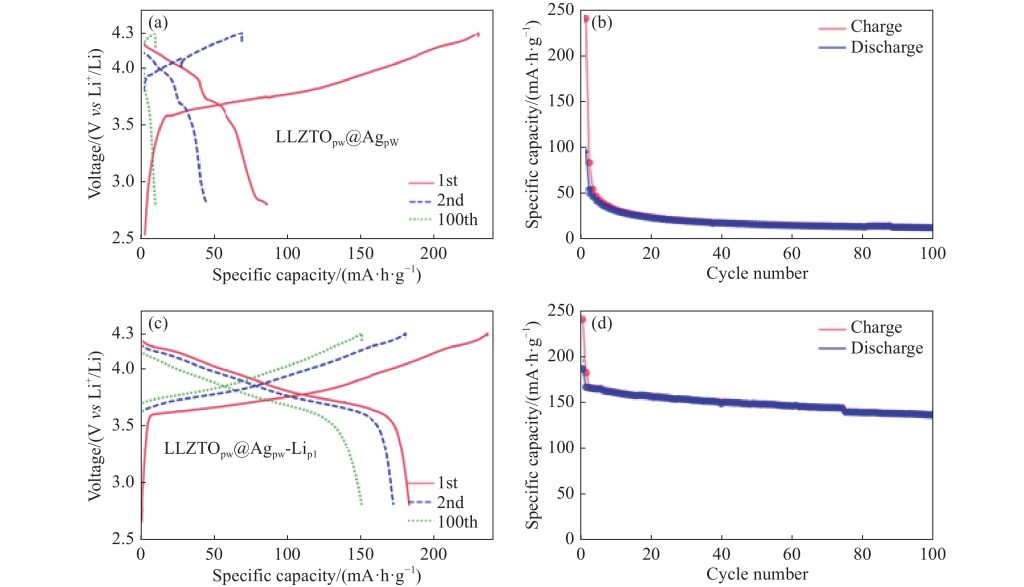
Capacity vs. Cycle Number Curve
The most commonly analyzed curve in cycle life testing is the capacity versus cycle number plot. This curve shows how the battery’s capacity decreases over the number of cycles. Initially, there may be a slight capacity drop during the first few cycles, known as the “formation” or “break-in” period. After this, the capacity should stabilize and then gradually decline as the battery degrades.
The slope of the capacity vs. cycle number curve provides information about the rate of capacity fade. A steep slope indicates rapid degradation, while a gentle slope suggests better cycle life performance. The point at which the curve intersects the 80% capacity threshold is used to determine the battery’s cycle life.
Voltage Profiles
The voltage profile during charge and discharge cycles can also reveal important information about the battery’s health. A typical voltage profile plot shows voltage on the y-axis and time or capacity on the x-axis. During discharge, the voltage should gradually decrease until it reaches the cutoff voltage. Any anomalies in the voltage profile, such as sudden drops or plateaus, can indicate issues such as internal resistance changes or electrode degradation.
By comparing the voltage profiles of early cycles with those of later cycles, one can observe shifts in the voltage behavior that correlate with the battery’s aging process. For example, an increase in internal resistance due to electrode passivation or electrolyte degradation will cause a more rapid voltage drop during discharge.
Data Fitting and Modeling
Advanced data analysis techniques can be employed to model the capacity fade behavior. Mathematical models, such as the empirical power law model or more complex electrochemical models, can be fitted to the experimental data. These models help to predict the future capacity fade and provide insights into the underlying degradation mechanisms.
For instance, the power law model expresses the capacity retention as a function of the cycle number raised to a certain power. By fitting this model to the data, one can extract parameters that describe the rate of capacity fade and compare different batteries or operating conditions.
Factors Affecting Cycle Life
Understanding the factors that influence cycle life is essential for optimizing battery performance and extending its useful life. Some of the key factors include:
Depth of Discharge (DOD)
The depth of discharge has a significant impact on cycle life. Shallow discharge cycles (e.g., discharging to 30% DOD) generally result in longer cycle life compared to deep discharge cycles (e.g., discharging to 100% DOD). This is because deep discharges can cause more severe mechanical and chemical stress on the battery electrodes and electrolyte.
Charge/Discharge Rates
Higher charge and discharge rates can accelerate battery degradation. High currents generate more heat, which can lead to thermal degradation of the battery components. Additionally, fast charging and discharging can cause lithium plating in lithium-ion batteries, which reduces the available lithium ions and shortens cycle life.
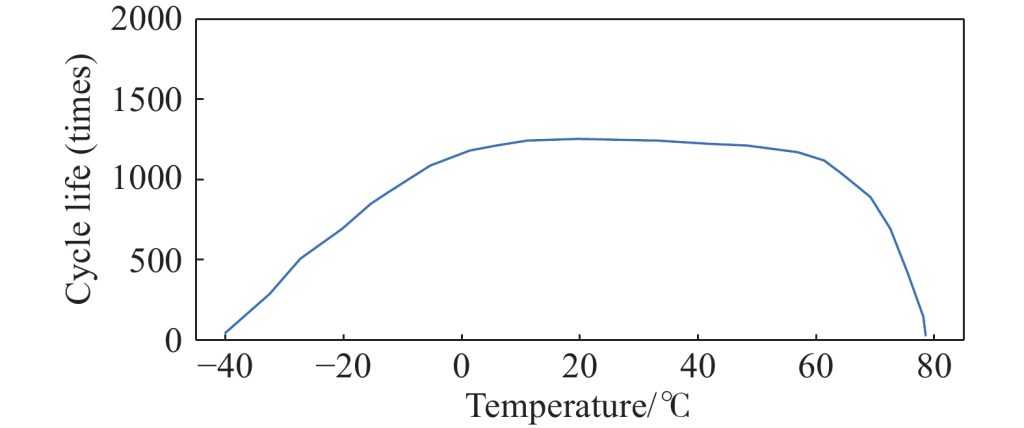
Temperature
Temperature plays a crucial role in battery performance and cycle life. Operating a battery at high temperatures can accelerate chemical reactions and degradation processes, while low temperatures can reduce the battery’s efficiency and capacity. Therefore, maintaining an optimal temperature range is important for maximizing cycle life.
Electrochemical and Material Properties
The inherent properties of the battery’s materials and electrochemical system also determine its cycle life. For example, the stability of the electrode materials, the quality of the electrolyte, and the design of the battery cell all contribute to its durability. Advances in materials science and engineering are constantly aimed at developing new materials and chemistries that can improve cycle life.
Conclusion
Battery cycle life is a critical parameter that affects the practicality and economic feasibility of batteries in various applications. Through careful testing and data analysis, we can gain valuable insights into the performance and degradation characteristics of batteries. Understanding the factors that influence cycle life allows us to optimize battery usage and develop better battery technologies for the future. As the demand for reliable and long-lasting energy storage solutions continues to grow, research and development in battery cycle life will remain a vital area of focus.
References
- Zhang, S. S., Xu, K., & Jow, T. R. (2006). Review—What Is Battery Life? From Intrinsic Aging Mechanisms to Practical Lifetime Prediction. *Journal of The Electrochemical Society*, 153(9), A1593-A1601.
- Armand, M., & Tarascon, J. M. (2008). Building better batteries. *Nature*, 451(7179), 652-657.
- Popov, B. N. (2004). *Electrochemical Power Sources: Batteries, Fuel Cells, and Supercapacitors*. John Wiley & Sons.
- Winter, M., & Brodd, R. J. (2004). What are batteries, fuel cells, and supercapacitors? *Chemical Reviews*, 104(10), 4245-4270.
- Liu, J., & Li, H. (2019). Recent progress in the cycle life improvement of lithium-ion batteries. *Journal of Power Sources*, 436, 224-236.