
The dQ/dV Curve: A Comprehensive Analysis of Its Significance and Applications in Electrochemistry
The dQ/dV curve, also known as the differential capacity curve, is a powerful tool in electrochemistry for analyzing the performance and characteristics of batteries. It provides valuable insights into the electrochemical reactions occurring within a battery during charge and discharge cycles, making it essential for researchers and engineers working on battery development and optimization.
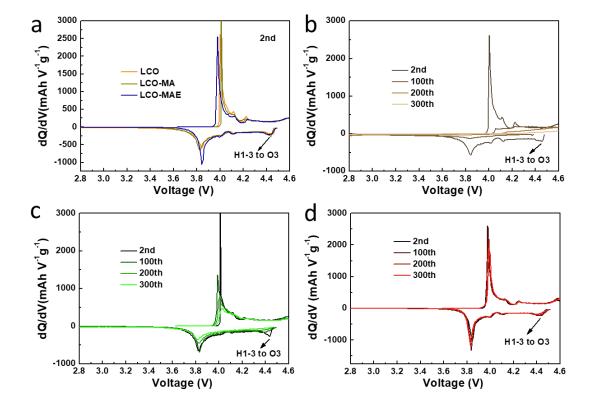
dQ/dV curves of LCO (b), LCO-MA (c) and LCO-MAE (d) at different cycles; (a) dQ/dV curve of the 2nd cycle.
Literature (Tan X, Zhang Y, Xu S, et al. High-entropy surface complex stabilized LiCoO2 cathode[J]. Advanced Energy Materials, 2023, 13(24): 2300147.)
Definition and Physical Meaning
The dQ/dV curve is derived from the relationship between the change in charge (dQ) and the change in voltage (dV) during the charging or discharging process of a battery. Mathematically, it represents the rate of change of charge with respect to voltage. The physical significance of this curve lies in its ability to highlight voltage plateaus and phase transitions associated with specific electrochemical reactions within the battery. Each peak in the dQ/dV curve typically corresponds to a distinct electrochemical reaction, and the area under the curve represents the capacity associated with that reaction.
For example, in lithium-ion batteries, the dQ/dV curve often shows distinct peaks corresponding to the intercalation and deintercalation of lithium ions into and out of the electrode materials. These peaks can be used to identify the specific materials and reactions involved, as well as to assess the reversibility and efficiency of these processes. The curve can also reveal the presence of irreversible reactions, as seen in the first discharge process of some materials, where certain peaks may disappear in subsequent cycles.
Curve Characteristics and Analysis
The shape and features of the dQ/dV curve can reveal critical information about the battery’s internal processes. The presence of multiple peaks indicates multiple electrochemical reactions occurring at different voltage levels. The height and position of these peaks can vary depending on the battery’s composition and state of charge.
For instance, in a lithium-rich layered oxide cathode, the first charge profile exhibits two distinct electrochemical stages at different voltage ranges. The first stage corresponds to the extraction of lithium ions from the LiTMO₂ domains, while the second stage corresponds to the activation of Li₂MnO₃ domains, further lithium extraction, and the oxidation of oxygen to peroxo species. The dQ/dV curve can clearly differentiate these stages, providing insights into the underlying electrochemical mechanisms.
Applications in Battery Research and Development
The dQ/dV curve is widely used in battery research for several purposes. Firstly, it aids in the identification and characterization of new electrode materials. By analyzing the dQ/dV curves of different materials, researchers can gain insights into their electrochemical behavior and potential suitability for battery applications. For example, the curve can help identify the specific reactions and phase changes associated with different materials, which is crucial for optimizing battery performance.
Secondly, the dQ/dV curve is useful for monitoring the health and aging of batteries. Changes in the shape and position of the peaks over time can indicate degradation mechanisms such as loss of active material or electrolyte decomposition. This information is crucial for developing strategies to improve battery lifespan and reliability. For instance, in a study of a NCA/graphite system battery, the dQ/dV curve was used to analyze the phase changes in both the cathode and anode materials during different stages of the battery’s life.
Practical Considerations for Curve Generation
Generating an accurate dQ/dV curve requires careful experimental design and data processing. It is important to use low current rates and small voltage intervals to minimize the effects of polarization and ensure precise measurements. Data smoothing and filtering techniques may also be necessary to enhance the clarity of the curve. Modern data analysis software can automate these processes, making it easier to obtain reliable dQ/dV curves for detailed analysis.
Additionally, the choice of data processing methods can significantly impact the accuracy of the dQ/dV curve. For example, using equal voltage intervals or equal capacity intervals for data points can lead to different curve shapes and interpretations. Therefore, researchers must carefully select and validate their data processing methods to ensure reliable results.
Comparison with Other Techniques
While the dQ/dV curve is a powerful tool, it is often used in conjunction with other electrochemical techniques to provide a comprehensive understanding of battery performance. For instance, cyclic voltammetry (CV) is another common technique used to study electrochemical reactions. However, unlike the dQ/dV curve, which focuses on the relationship between charge and voltage, CV measures the current response to a controlled voltage scan. The dQ/dV curve can provide more detailed information about the capacity changes associated with specific reactions, making it complementary to CV in battery analysis.
Future Directions
As battery technology continues to advance, the dQ/dV curve will remain a key instrument for understanding and improving the performance of these critical energy storage devices. Future research may focus on developing more sophisticated data processing algorithms to enhance the accuracy and resolution of dQ/dV curves. Additionally, integrating dQ/dV analysis with other advanced techniques, such as in situ X-ray diffraction or spectroscopy, could provide even deeper insights into the electrochemical processes occurring within batteries.
In conclusion, the dQ/dV curve is a vital tool in the study of battery systems. Its ability to provide detailed information about electrochemical reactions and battery performance makes it indispensable for both fundamental research and practical applications. As battery technology continues to advance, the dQ/dV curve will remain a key instrument for understanding and improving the performance of these critical energy storage devices.
ABOUT NEWARE:
Neware was founded in 1998. We are trusted by ATL, BYD, CATL, Tesla, Apple, HUAWEI, SolarEdge, etc. We provide battery testing solutions for testing battery cell, module, pack, supercapacitor, BESS, etc. If you want to do capacity, cycle life, pulse, DCIR, GITT, HPPC, or EV driving simulation test, please feel free to contact us.